Running the Model Interactively
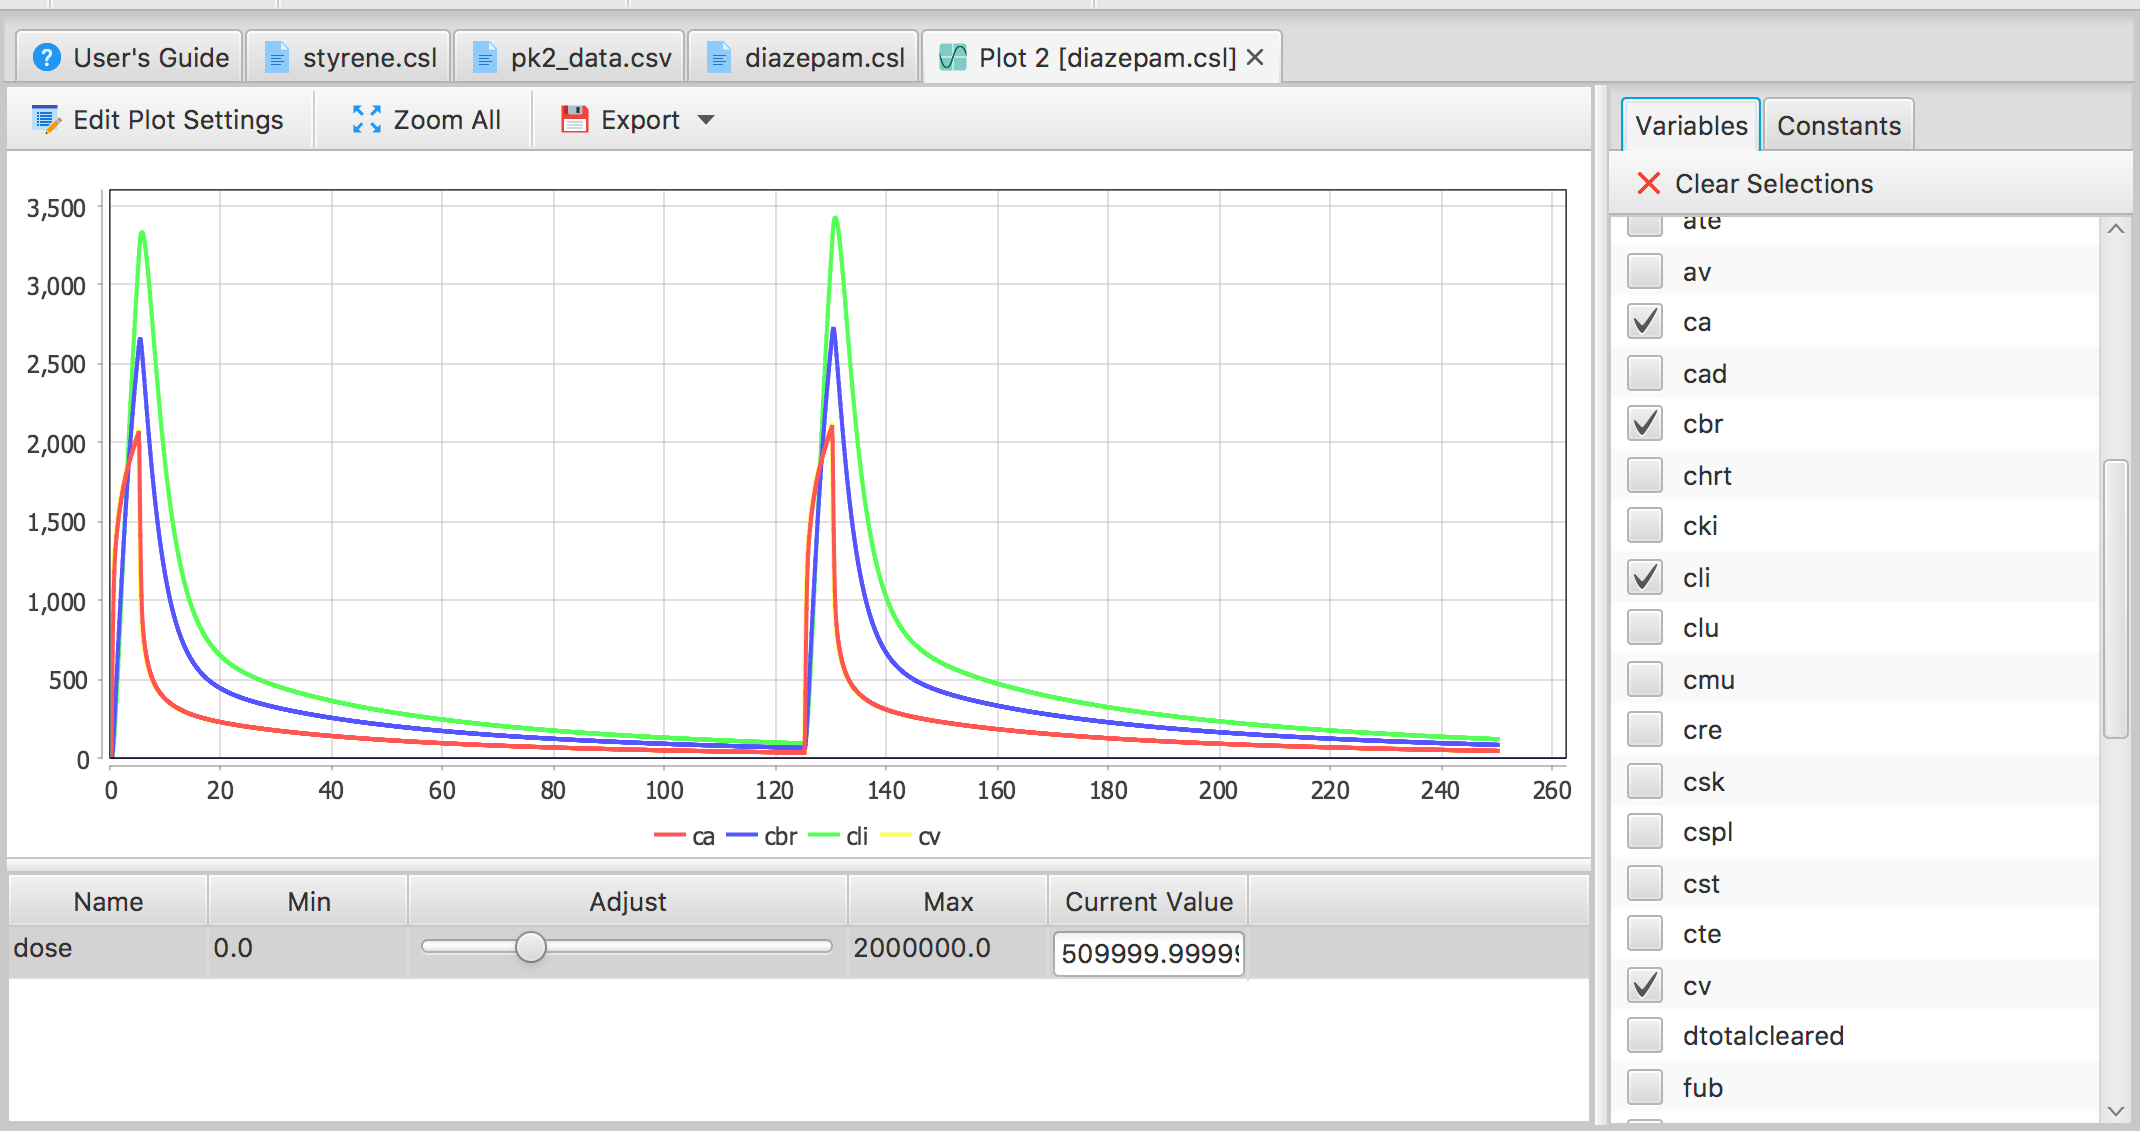
To run the model, press the “Start” button. After building and executing the model, a default plot window will be displayed. By default, the first 5 model output variable (in the order in which they were found in the model) will be plotted. To change the outputs included in the plot, or to add sliders to explore effects of parameter variation interactively, check or uncheck the entries in the “Variables” and “Constants” tabs/lists at the right side of the plot window.
Pressing the "Run" button on the toolbar when a CSL file is the active (selected) document will cause the simulation to be rebuilt (this typically takes only a fraction of a second) and executed, after which the interactive plot widow is displayed. A summary of the components of this window is discussed in the Editor Windows section. In general, this window can be used to adjust the values of any (scalar) model constants and see the simulation update selected (scalar) trajectories immediately.
Note that the interactive plot window reflects a snapshot of the model code when the source file was built and executed. This means that if any changes are made to the model file, any currently opened plot window will not necessarily reflect the results of running the modified model. A new plot window opened after modifying the model will be linked to the "new" version of this model. This does, however, provide some flexibility in comparing the result of a temporary modification to the model with the unmodified version.