Editor Windows
Editor windows provide the user interface to model and script code, data (CSV) files, and model outputs (plots). Each type of editor window roughly corresponds to a kind of “document” understood by Magnolia. The opened files are displayed as tabs in a tabbed view in the center of the Magnolia user interface. A file is closed by selecting the tab for that file and clicking the “x” in the tab. If a file has been edited since it was opened or last saved, a prompt will be displayed allowing you to either cancel the close operation and save the file, or discard any changes.
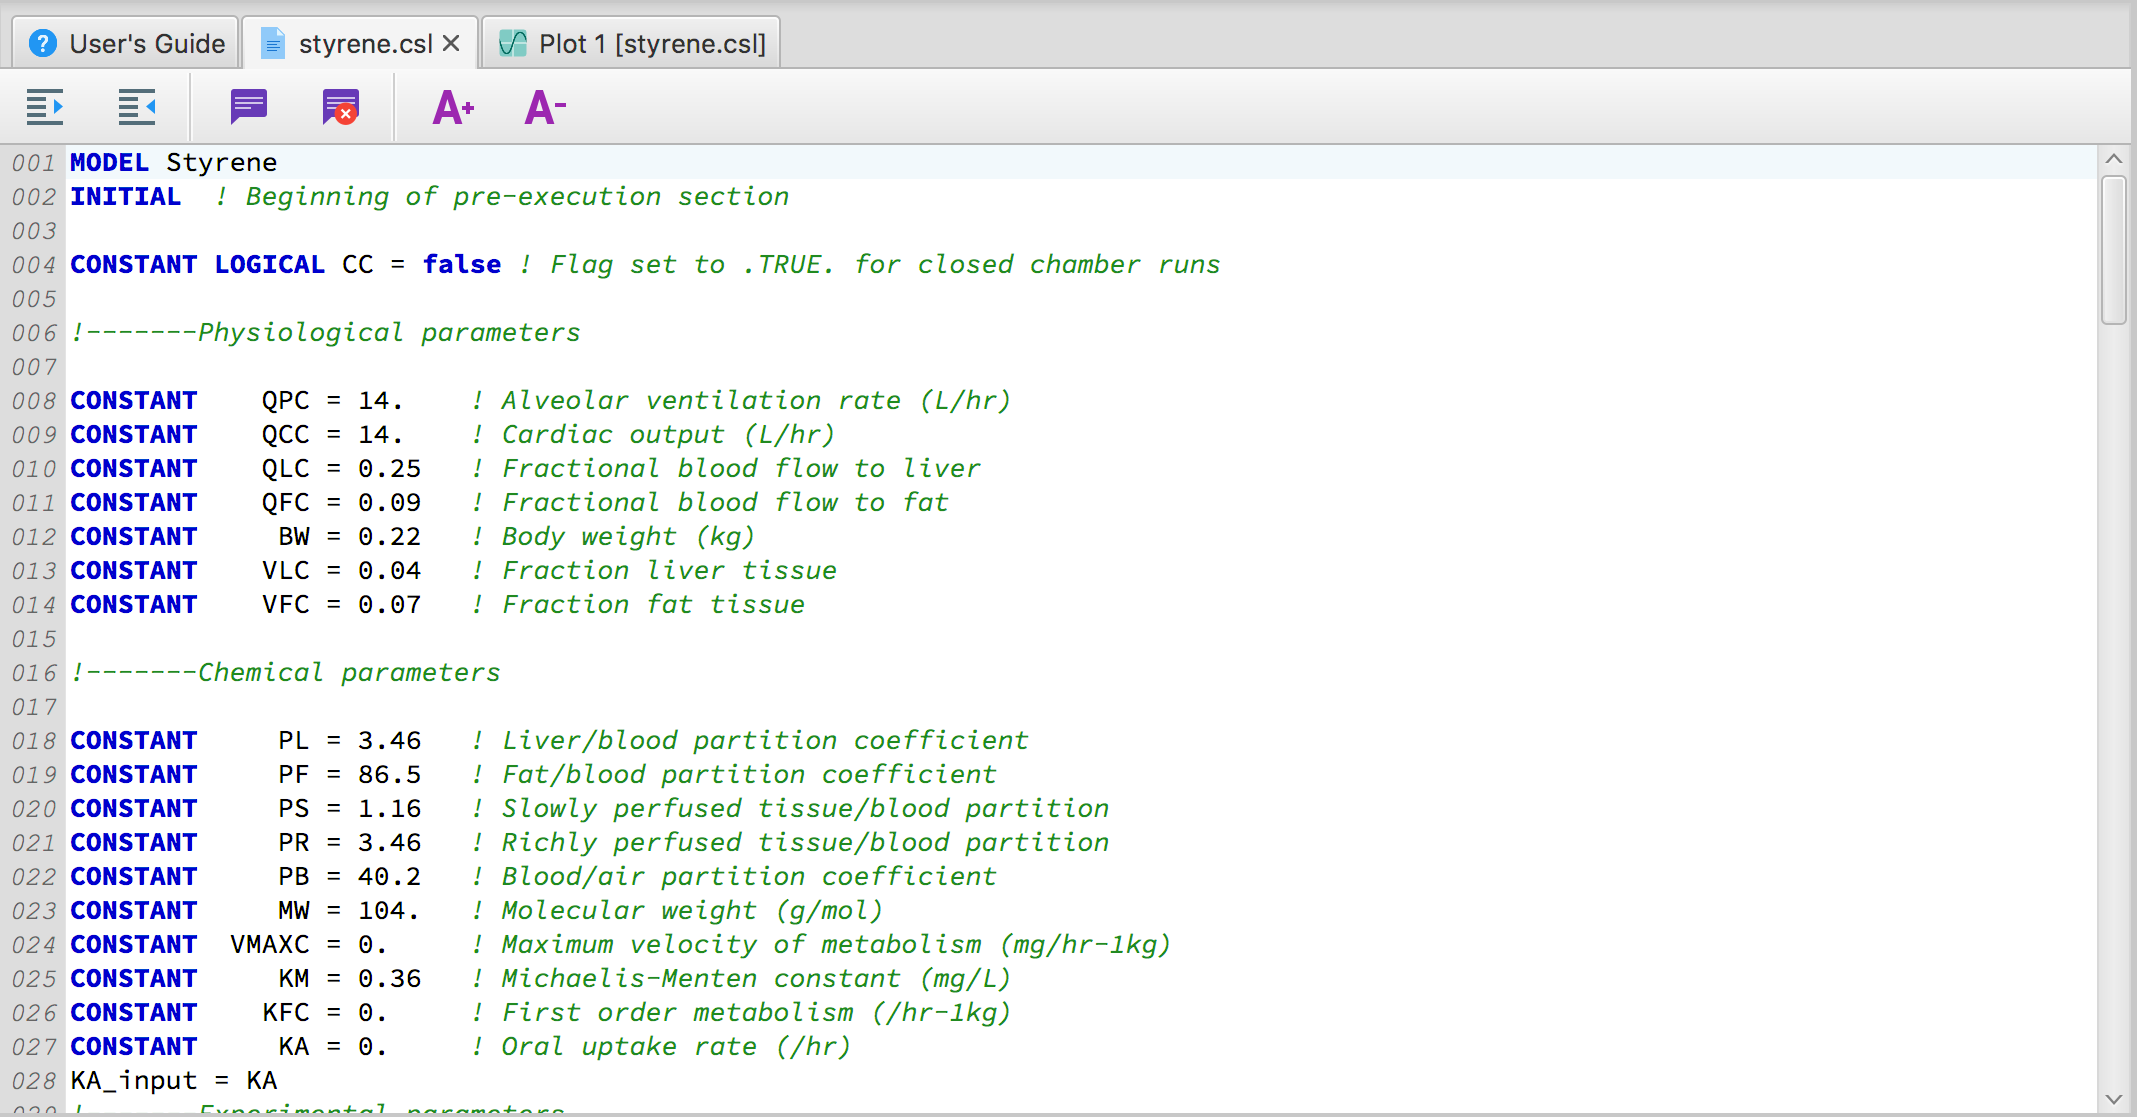
Code Editor Windows
The code editor window is used to write and modify the CSL, CMD and Python code used to build the model and any associated scripts. Color-coded syntax highlighting is supported. Cut/copy/paste/delete and undo/redo are supported through normal system key codes, or through menu/toolbar options. To execute the file, select the “Start” button on the main menu. If the selected tab contains a CSL file, the model will be built and executed, and a default plot window created at the conclusion of the simulation run. If the selected tab contains CMD or Python code, the script will be executed.
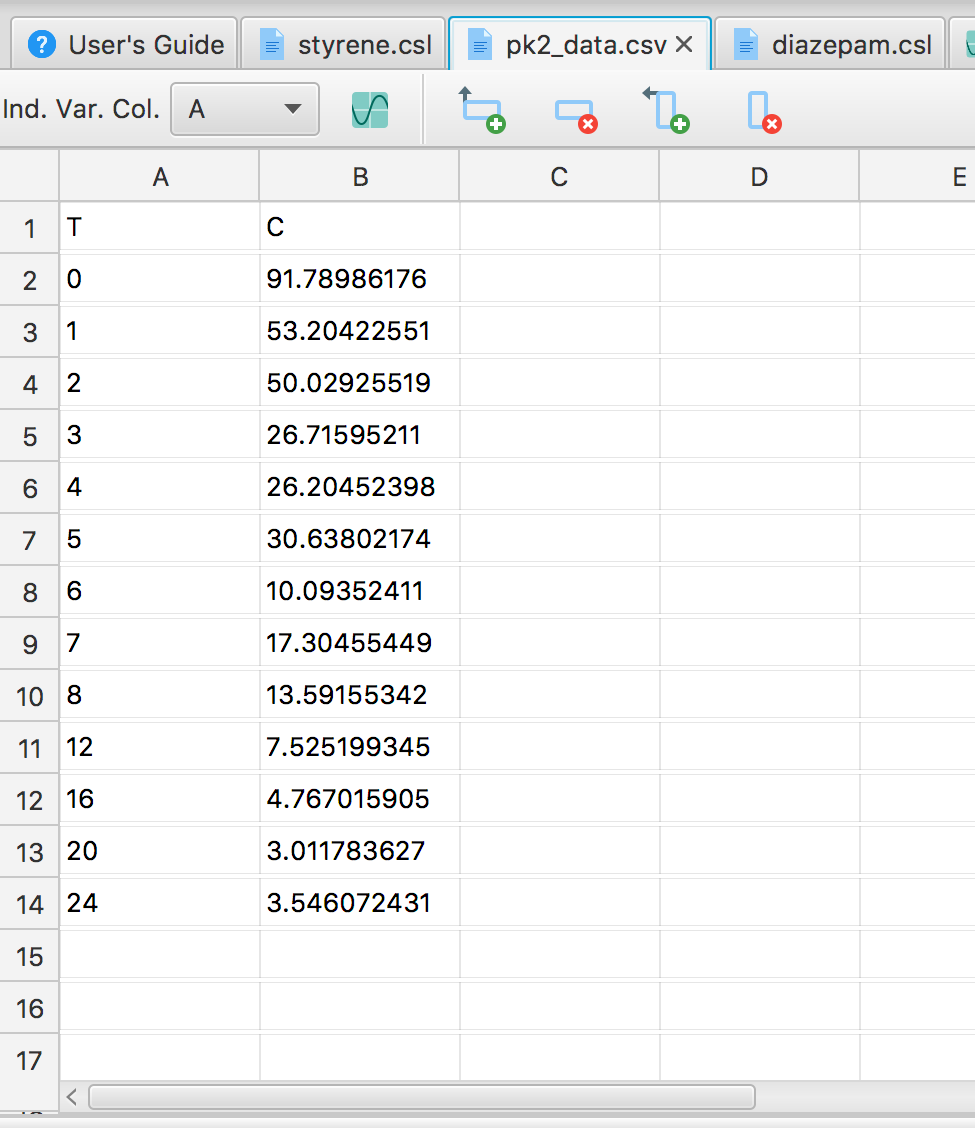
CSV (Spreadsheet) Editor Window
A simple spreadsheet control is provided to allow rudimentary viewing and editing of data contained in comma-separated values files. Values in the cells can be edited similarly to a full-featured spreadsheet; limited copy and paste to and from external applications is supported. The toolbar options at the top of this window can be used to add/remove columns/rows, or to add the selected data range to a plot.
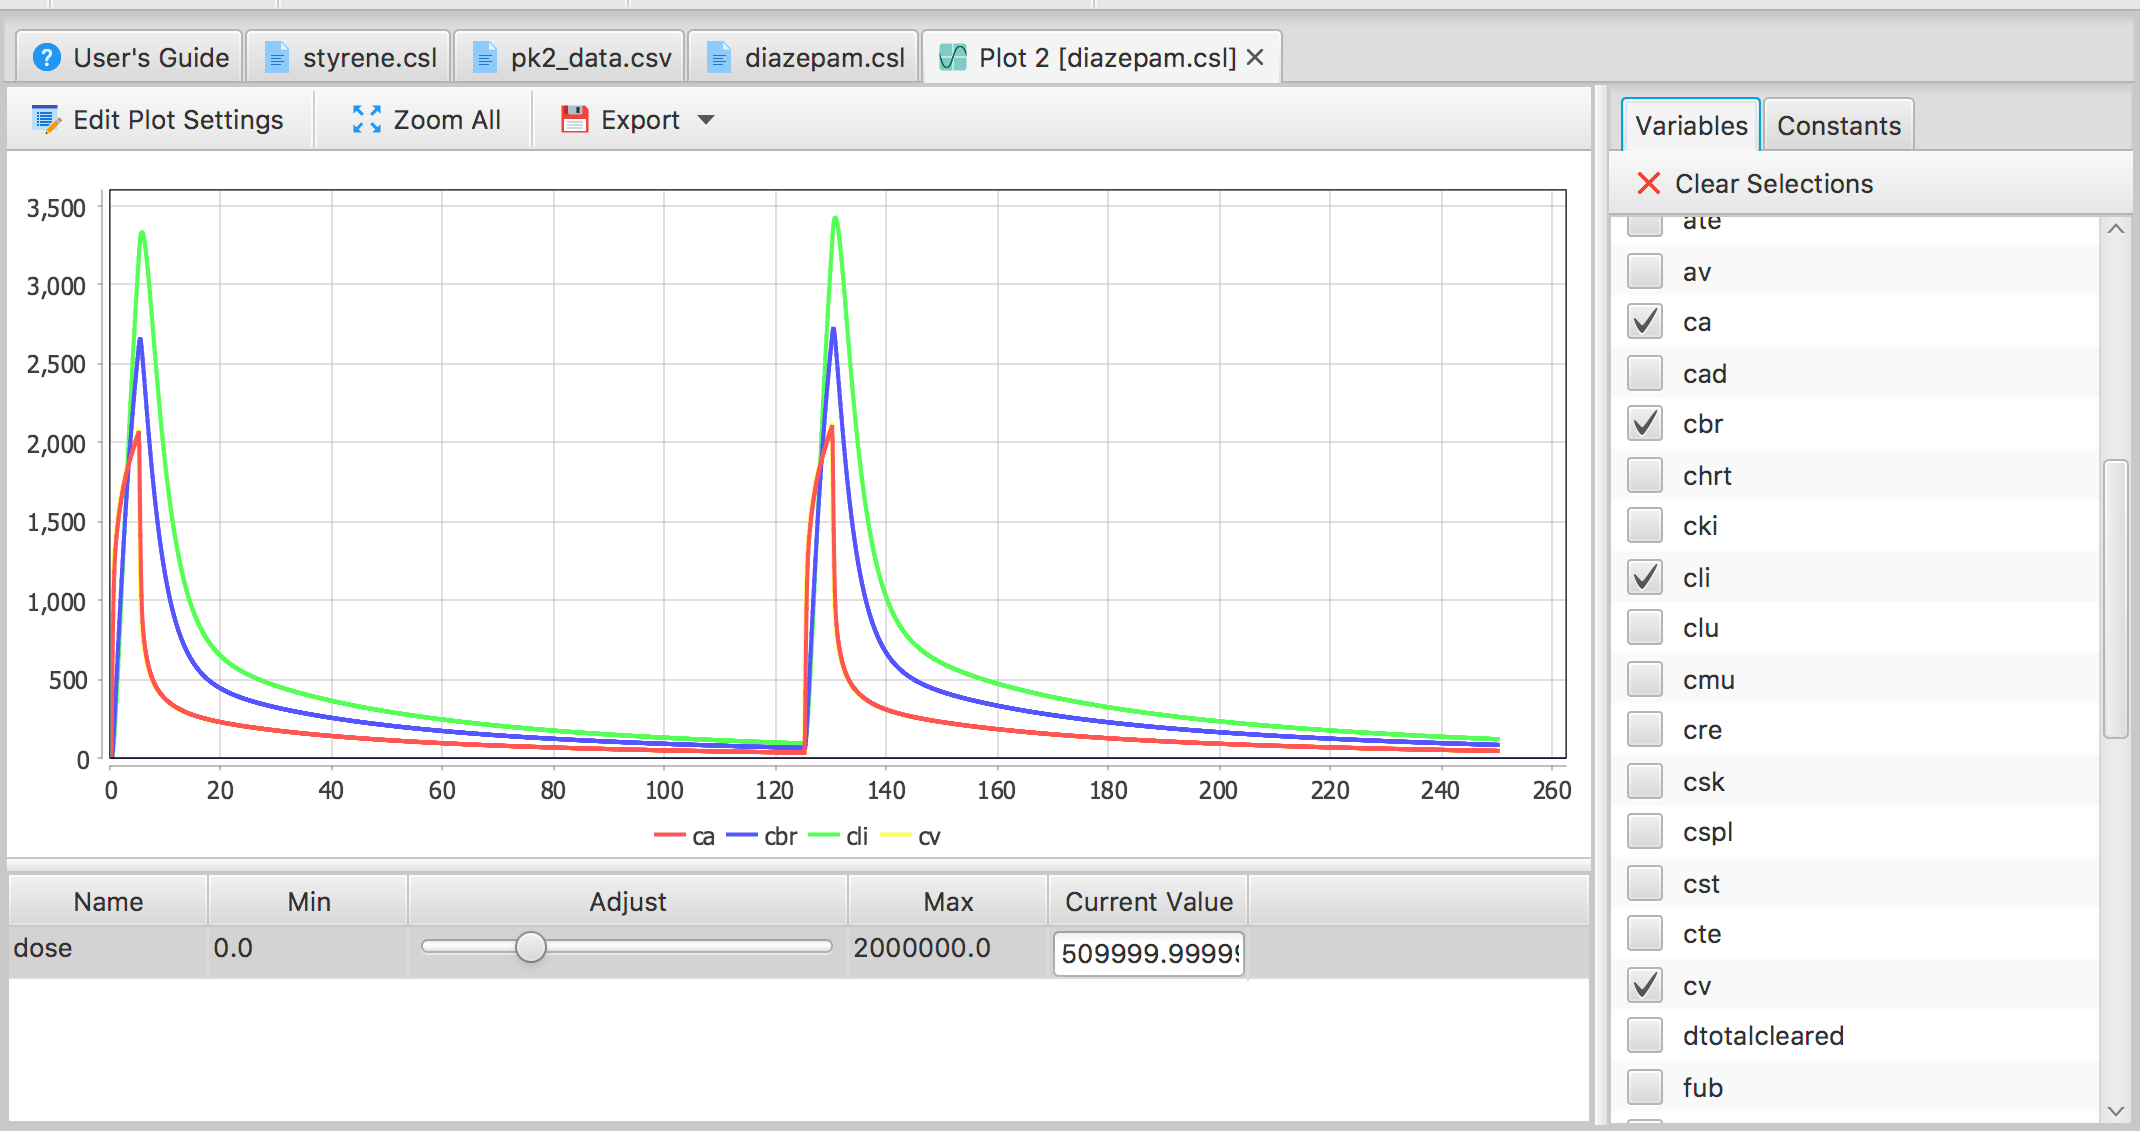
Plot Windows
In addition to displaying time trajectories of model states and outputs, the plot window provides specific functionality for interactively exploring the effect of changes in parameter values on model outputs. To vary a parameter, click the “Constants” tab on the right side of the window. This list contains an entry for any parameter defined by a CSL “CONSTANT” statement in the model. Check any parameters to be included in the small table below the plot. Each row in the table corresponds to a selected constant. Drag and release the slider to see the effect of a change in that parameter’s value on the model outputs. Upon releasing the slider, the simulation will automatically re-run and update the plot. To change the outputs included in the plot, select items in the “Variables” tab list view. Note that if an output is selected that wasn’t selected in the previous run, the simulation will have to be manually re-run to compute the values for that output. To do this, simply click the “Start” button in the toolbar.